“FEARS is a very efficient new time series classification method that exploits multiple representations and is capable of extracting informative descriptors”
What is a time series?
A time series is a sequence of values indexed in time order, i.e. a curve. As shown in Figure 1 below, time series values are usually measured at regular intervals (e.g. every second). A time series is defined over a specified period of time, meaning it has a set number of values.

Figure 1 — Example of a time series S(t) consisting of a sequence of values (S1, S2, etc.) sampled at regular time intervals (t)
Time series are a very common type of data in the Orange Group. For example, the operation of a Video on Demand (VOD) server can be qualified by several indicators measured over time, such as CPU, RAM, and network usage. This means it is a multivariate time series, as several indicators are measured at each interval.
What are the possible learning tasks?
The literature on time series discusses a range of learning tasks such as “forecasting”, which means predicting the continuation of a time series, see Figure 2(a), or “clustering”, which groups time series data into homogeneous packages, see Figure 2(b). In this post, a particular focus is placed on time series “classification”, the purpose of which is to assign a time series to one of the classes within a predefined set. Figure 2(c) shows a binary classification problem represented by the colours red and green. The learned model is depicted by a separator (the dotted orange line). The objective is therefore to train a model to distinguish between the two classes as well as possible.
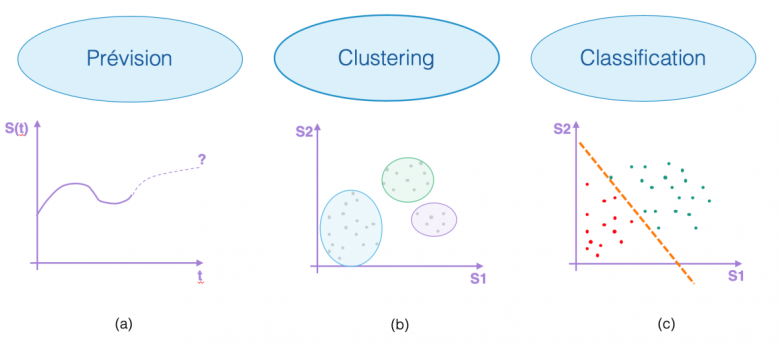
Figure 2 — Illustration of the different learning tasks
How can Orange use this?
There are many possible uses for this within the Orange Group. These uses motivated the development of a new approach called FEARS. For example, use cases for “predictive maintenance” can be framed as time series classification problems. Let’s take the example of our VOD server again (see Figure 3). A predictive maintenance model would predict either class 1, meaning “will crash in ten minutes”, or 0, meaning “will work fine in ten minutes”, based on the indicators (CPU, RAM and network) measured over the last rolling hour. Once it has learnt past data, the classifier will be able to predict the server’s operating condition for the next ten minutes from the recently measured indicators, in real time.
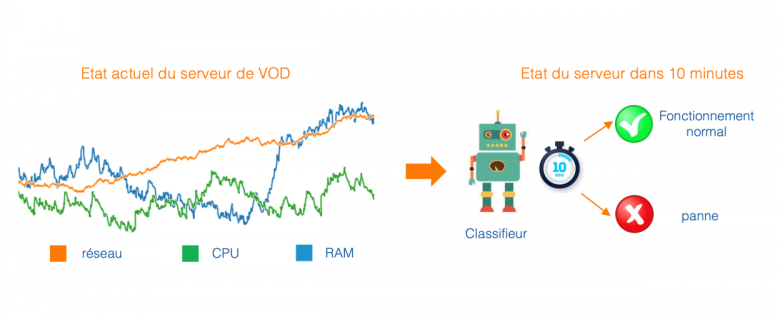
Figure 3 — Predictive maintenance for a VOD server
Understanding good representations and descriptors
Within the scientific community, there is a consensus that, in order to obtain high-performance classifiers, it is necessary to transform the time series. This means moving from the time domain to an alternative data representation. It is also necessary to extract informative descriptors from the series to facilitate the learning of the classifier. These descriptors are values that characterise the time series (e.g. the standard deviation of the measuring points, the gradient of the series, etc.) and are used as input for the classifier. The FEARS[1] approach proposes automating these two stages and carrying them out simultaneously.

Figure 4 — “Two Patterns” dataset: original time-based representation, (a) on the left; cumulative integral values, (b) in the centre; cumulative double integral values, (c) on the right.
To illustrate the importance of these two stages, Figure 4 shows an example of a public dataset named “Two Patterns” represented in multiple ways. Figure 4(a) shows the original time series represented in the time domain. In this case, it is extremely difficult to distinguish between the two classes (represented by the colours red and blue). Figure 4(b) shows the cumulative integral values of the same time series. Here, the classification problem becomes much easier. Very informative descriptors can be easily extracted from this alternative representation. For example, counting the number of values greater than 10 or less than -10 are two very good descriptors for the model for class prediction. Figure 4(c) shows the cumulative double integral values of this time series. The classification problem becomes trivial because a simple threshold applied to the last value makes it possible to perfectly distinguish between the two classes. In practice, the choice of representation and descriptors greatly influences the performance of learned classifiers. The FEARS approach aims to automate these choices.
The suggested approach
Our approach is able to extract informative descriptors from the series, while simultaneously selecting the most useful representations. Interested readers can find more details about the FEARS approach in the scientific publications below: ([5], [6], [7]). Figure 5 outlines the general application of the approach and shows the different stages:
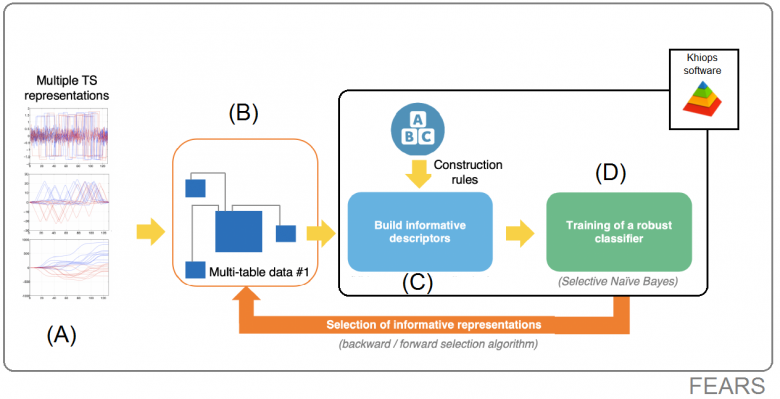
Figure 5 — Block diagram of the FEARS approach
(Part A): The original time series is transformed into multiple alternative representations. By default, seven representations are chosen, such as derivatives, integrals, autocorrelation and the Fourier transform. However, the choice of these representations remains in the hands of the end user, sometimes an expert in the given field of use.
(Part B): These different representations are stored in a relational database. The main table contains the identifier of each series, as well as the class to be learned (in the Two Patterns dataset, it is composed of the red and blue classes). The secondary tables contain the measurement points for each representation of the series.
(Part C): Descriptors are extracted from the secondary tables using a method of “flattening” relational data (called propositionalisation). To do this, Khiops is used to generate informative descriptors without risk of overfitting (i.e., rote learning, where it stops generalising).
(Part D): A classifier is then learnt by using the extracted descriptors as input data.
(Orange arrow): Stages B, C, D are repeated several times in order to select the best subset of representations. A representation may prove unnecessary for some datasets. Keeping unnecessary tables in relational data is detrimental to the performance of the learned classifier. This is why, at this stage, a “forward”[2]/“backward”[3] selection algorithm is used.
Since there are several ways to encode the different representations in a relational schema (switching from Part A to B), the algorithm is executed twice in order to test two different relational schemas and to keep the best.
The suggested approach proves highly competitive when compared with state-of-the-art methods while extracting interpretable descriptors. In addition, FEARS is based on an original formalisation with the adoption of a relational perspective that is rarely used for Time Series. This approach is based on the MODL framework [8], which has almost no parameters and requires little hardware resources since it is implemented within the Khiops software, a product of Orange Labs research.
The results:
Experiments were conducted in articles [5] and [6]. FEARS was tested against twelve competing approaches on 85 datasets that constitute a standard benchmark for the scientific community. The results show that if the dataset contains a sufficient number of training examples [4] then FEARS is in the top three state-of-the-art methods.
This is illustrated in Figure 6, where the methods are graded by their average performance ranking for the 85 datasets (best method on the left, worst on the right). FEARS places in second position for the datasets tested. Readers will find more details in [6] and may find that FEARS has other advantages. This approach is particularly scalable and produces interpretable results.
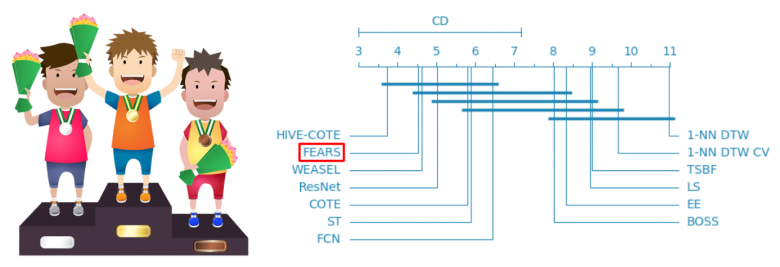
Figure 6 — Classification of the FEARS approach with respect to the other 12 state-of-the-art methods. FEARS is one of the three best methods along with HIVE-COTE and WEASEL. A description of the competing methods (Hive-Cote, ResNet and 1-NN DTW) can be found in [5].
Perspectives, open challenge
At the crossroads of time series domains and relational data mining, FEARS is a very efficient new time series classification method that exploits multiple representations and is capable of extracting informative descriptors.
Storing multiple representations of time series in relational data schema, interpretable descriptor construction/selection, and representation selection are the key concepts of FEARS. The whole process achieves very competitive accuracy results compared with recent state-of-the-art contenders, provided there are enough training examples.
In addition, the suggested approach allows interpretable descriptors to be extracted from the selected representations, which achieves a highly advantageous compromise between (i) calculation time, (ii) accuracy of learned models and (iii) the interpretability of descriptors constructed. Thus, FEARS can be easily used in an industrial context due to its high level of automation, performance and ease of use.
The relational perspective on time series classification offers a natural perspective for future work, such as the processing of high dimensional multivariate time series. The secondary tables of the relational schema could store the many dimensions of the multivariate series. Therefore, an effective and automatic way to select the dimensions suited to the learning task remains to be found.
FEARS can already be used in Data Science projects as a Python Library is available.
[1] FEature And Representation Selection approach for time series classification
[2] This strategy is based on an empty set. The representations are added one by one. At each iteration, the optimal representation according to a certain criterion is added. The process ends when there are no more representations to add.
[3] This strategy is based on the initial representation set from the forward stage. At each iteration, a representation is removed from the set. This representation is such that deleting it produces an improved new subset.
[4] This means more than 500 time series, which does not seem very big in the age of big data.
[5] Gay, D., R. Guigourès, M. Boullé and F. Clérot (2013). Feature extraction over multiple representations for time series classification. In New Frontiers in Mining Complex Patterns – Workshop NFMCP 2013, ECML-PKDD 2013, Revised Selected Papers, pp. 18–34
[6] Bondu, A., D. Gay, V. Lemaire, M. Boullé and E. Cervenka (2019). FEARS: A FEature And Representation selection approach for time series classification. In Proceedings of The 11th Asian Conference on Machine Learning, ACML 2019, Nagoya, Japan, 17–19 November, 2019, pp. 1–17.
[7] Gay, D., A. Bondu, V. Lemaire, M. Boullé and F. Clérot (2020). Multivariate time series classification: a relational way. In International Conference on Big Data Analytics and Knowledge Discovery (DAWAK 2020).
[8] Bondu, A., M. Boullé and D. Gay. Data grid models, slides for the tutorial given at the conference “Extraction et Gestion des Connaissances” (EGS) 2013, Toulouse, France. http://www.marc-boulle.fr/publications/TutorialEGC13.pdf.
[9] Adeline Bailly, “Time Series Classification Algorithms with Applications in Remote Sensing”, PhD Thesis, Rennes, 2018


