


Many existing ‘social borders’ are well known as they are anchored in the history of nation-building or in particular regional developments. Take for instance Belgium, where a north-south divide between the Dutch-speaking northern part, Flanders, and the French-speaking southern part, Wallonia, has been a long-standing division line marking a barrier between different regional groups and cultural identities. Interestingly, this linguistic separation can be clearly observed from communication patterns between mobile phone customers in the country [1].
In this paper we investigate whether similar borders can be detected within other European countries like the Great Britain, France and Italy.
Community detection based on communication patterns
In this study, we use data from country-wide phone communication networks to detect and understand the outlines of communities within European nations, namely: the Great Britain, France, Italy, and Belgium [2]. This process is best understood in two steps. Firstly, one needs to know how the communication patterns are constructed based on telephone data, and second, a better insight into the way the community detection algorithm works is key to understanding how ‘communities’ are defined.
Communication patterns are constructed between different locations within a country based on the aggregated duration of all calls having their origin in the first and their destination in the second location. This process generates a weighted (by aggregated duration) and directional (from A to B, from B to A) network. Of course, this methodology cannot be applied to all locations in a country. Rather, the network is based on a number of fixed locations or zones that are used for geolocating the captured communications, such as cell phone towers or the zip code of the customer’s home.
An easy way to investigate constructed communication patterns is to have a look at those originating from a single municipality. Typically, these patterns will show a lot of interactions with neighbouring municipalities and increasingly fewer interactions with municipalities that are further away [3]. While it is possible to calculate the probability that one municipality will be contacted by another, it remains difficult to detect ‘social borders’ on a larger scale than that of the individual municipality.
Recently, community detection algorithms have overcome this issue as they are now able to detect and define user groups, locations, or regions that have a higher degree of commonality compared to other groupings. Based on the total network of all communication patterns, we used an algorithm for community detection that looks for groups of locations (and thus communities) that have dense connections between them but sparse connections with other groups (for more information see [2]).
Studying spatial communities
We can observe that all calculated communities (Fig.1, coloured) are spatially homogenous and coincide quite well with existing administrative boundaries (in black). This is a surprising finding given that one cannot foresee which locations will belong to which communities, nor can one know how many different locations will form a community. The algorithmic treatment of the topology and information of a nationwide interaction network yields opportunities to delineate regions based on daily communication patterns that are strikingly similar to existing regions.
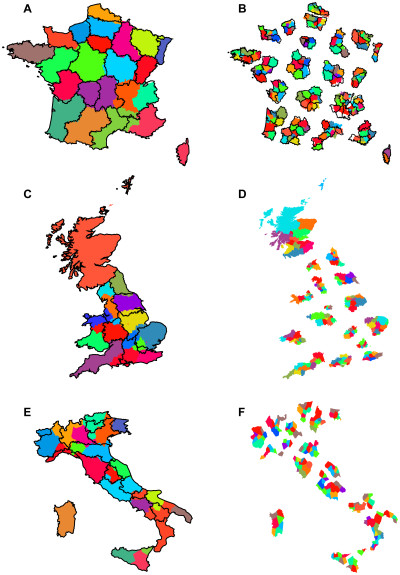
The results for France (1A) show that the created community map follows administrative borders with striking accuracy. There are two major exceptions: the regions of Limousin and Auvergne are to most parts joined together and Rhône-Alpes is split into three. This indicates that some parts of the communication network in the south of Rhône-Alpes are better connected to the neighbouring regions to the south and south-west than to their home region.
In Great Britain (1C), the most obvious difference between the detected groupings and the administrative partitions is that Wales and, to a lesser extent, Yorkshire, seem to have been incorporated into regions dominated by the major cities of the West and East Midlands regions, respectively. We have also “found” a new region extending to the west of London.
The partitioning of Italy (1E) also generally corresponds to the official division of land, but here a number of border shifts between neighbouring regions are observed. Some notable deviations from political borders include the city of Verona being part of the Trentino-Alto Adige region, and the most eastern part of Liguria, La Spezia, merging with Tuscany. Additional regions are scattered throughout the country, with small settlements in the western part of Emilia-Romagna, and Sicily being split into three.
So, the country-wide networks of human telephone interactions create spatially cohesive regions generally consistent with the geo-partitioning of greater administrative regions. It is possible to go one step further and apply the community detection method to a second level. Applying the algorithm to the sub-network inside each of the detected regions uncovers a second level of partitions. The panels on the right in figure 1 (B, D, F) show that second-level communities possess the same general properties as the first-level partitions – all the communities are geographically cohesive.
Despite various technological advances in communications, social networks and daily interactions continue to revolve primarily around local concerns. Social interaction patterns follow a local context far from the global village prophecy. Thus, several other studies have shown that in general about 80% of all calls cover distances of no more than 50 km, or that the probability that two individuals are connected by a telephone link is inversely proportional to the square of the distance between them [3].
Furthermore, it did not come as a surprise that social networks are framed by geographical distance; the ‘natural geography’ emerges from our daily communications reinforces the preexisting political, cultural or administrative lines at every scale.
Findingmajor dividing lines
Considering the interesting case of Belgium’s bipartition, we could ask ourselves what a bipartition in France, Italy or the Great Britain would look like. What if we asked the community detection algorithm to render only two communities? Would the algorithm be able to create a meaningful bipartition of a country based solely on our communication patterns? Might it even reflect a well-known cultural, political or administrative border?
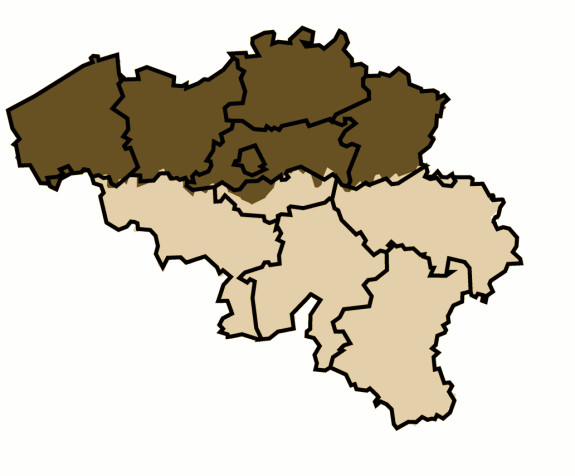
Running the bipartition algorithm, we can see an almost perfect separation of two communities according to the two well-known linguistic territories: Flanders and Wallonia. Some interesting findings can be explored, such as the inclusion of Brussels in the Flanders territory and the emergence of a small corridor south of Brussels as part of the Flanders community (see above). Only 3.5% of all communications cross the ‘linguistic border’. Clearly, the Belgian bipartition is a strongly institutionalized one and so it is interesting to investigate the application of the bipartition algorithm to other countries, as shown in figure below.
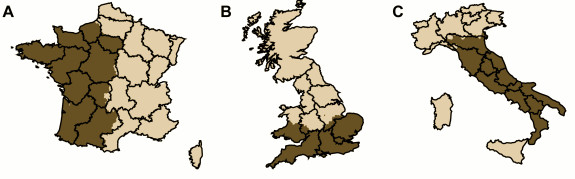
The next strongest split is France, with just 5.7% of links straddling the West-East divide. Surprisingly enough, the interaction split is no longer linked to the old linguistic barrier of the Occitan and Oïl languages (South/North) but runs along the western borders of Normandy, Paris-Region, Centre, Limousin, and Midi-Pyrénées.
In Italy only 7.8% of communications cross a line running roughly along the northern border of the Emilio-Romagna region and separating the industrial and commercial metropolises of Milan, Turin and the Po valley from the southern part of the country. And telecommunications data in Britain show that only about 9.5 per cent of communications cross a line about 150 km north of London.
Concluding remarks
Applying a community detection algorithm to extensive communication datasets of 4 countries, we showed that it has now become possible to derive spatially coherent communities that align remarkably well with existing administrative borders even though the methodology is not predetermined by geography. The technique employed here proves to be robust over different datasets from different countries and allows for multi-level investigations as well as calibration for more generalized patterns, like bi-partitioning.
The results of our investigations are compelling. They provide a rather objective, albeit generalized view of how communications create a landscape that often does and at times does not reflect existing political, economic or administrative borders. The fact that these regions are derived from digital records of individual actions offers opportunities to address long-standing questions related to identity formation or border policies in a more objective and quantitative way.
The objectivity that stems from the passive tracking of large numbers of people and activities also has its downside. It is very difficult to attribute direct interpretations of why these communities and division lines exist. Uncovering the invisible social communities and borders on a large scale and in a more objective fashion does not mean one can infer the reasons for, or the implications of, these borders.
It is one thing to acknowledge borders; it is another thing to comprehend, appreciate and integrate them in order to take more effective action and obtain more valuable insights. What can be extracted from this study, however, is a renewed appreciation for the way daily behaviour creates general structures that can be revealed, analysed and used to achieve greater insight into the human condition and contemporary social patterns.