“The links between reduced mobility and socioeconomic factors highlight their role in the uneven progression of the pandemic”
The outbreak of the COVID-19 pandemic has confronted the world to unprecedented challenges, calling on countries to take urgent and resolute action to better respond to the health emergency. Among these, in the absence of a widely available vaccine and/or effective treatment, restrictions on mobility are a last resort to combat the spread of infectious diseases. Daily life population mobility, in fact, offers opportunities for contacts, along which the disease may propagate. Restricting movements reduces this transmission.
Throughout the successive phases of the pandemic, French authorities have introduced several measures to reduce the social mixing, then to contain the spread and relieve pressure on the health-care system [1]. The restrictiveness of these policies varies from closures of non-essential services to remote work, curfews and, during the acceleration phases, nationwide lockdowns.
Assessing the impact of these measures on the movements of the population is crucial in helping to identify changes in behavioural and societal dynamics that affected the viral diffusion, and that shape but also limit the extent of restrictions.
Travel flow data provided by Flux Vision (Orange Business Services) [2] were mobilized to study the changes in the mobility of the French population in response to the epidemic burden and the interventions imposed by the French Government, at both a local and national level [3], [4], [5].
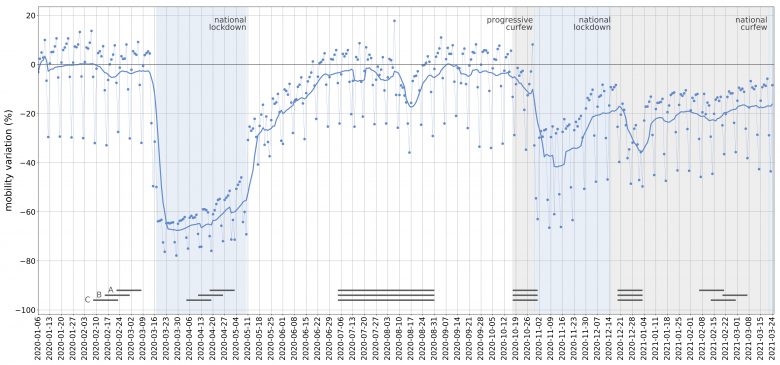
Figure 1: Mobility variation in France from January 6, 2020 toMarch 25, 2021, defined as the relative variation in the daily number of trips compared to the pre-pandemic period (February 3-9, 2020). Dots indicate the date’s values and the thick line indicates the rolling average with a 7-days windows. Blue areas represent lockdowns and grey areas represent curfews. The horizontal grey lines provide information on school holidays for the three areas (A, B, C) as defined by the Ministry of Education.
This analysis shows that changes in mobility occurred even before measures were implemented. During the first lockdown (March 17 to May 10, 2020), the transition signaling the drop in mobility lasted almost a week , anticipating its enforcement, Figure 1. Individuals spontaneously started reducing their mobility faced with the risk of infection. At the same time, in order to mitigate the constraints of lockdown, in relation to housing occupancy or isolation for example, the exodus of large urban areas led to increases in mobility flows out of certain regions (such as Île-de-France) towards others (such as Brittany and Normandy), Figure 2.
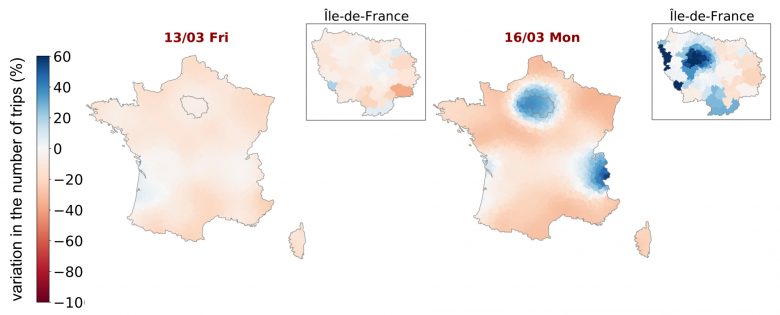
Figure 2: Variation in traffic on Monday, March 16, day of announcement of lockdown to be implemented the day after at noon. On the left, the outgoing traffic; on the right, the incoming traffic. Source: [3]
No increase in viral circulation was visible in the destination regions in the following weeks, as the lockdown strongly stemmed epidemic activity in all regions.
Overall, trips were reduced by about 65%. This reduction can be explained by sharp declines in mobility related to work or schools, especially during rush hours, as well as weekend and for long-range trips. Particularly in Paris, before the first lockdown, 95% of outbound traffic was to destinations within 200 km from the city centre (about the distance between Paris and Lille). Whereas, during the lockdown, 95% of these outbound flows reached destinations within a 29-km radius (about the distance from the centre of Paris to Disneyland), Figure 3.
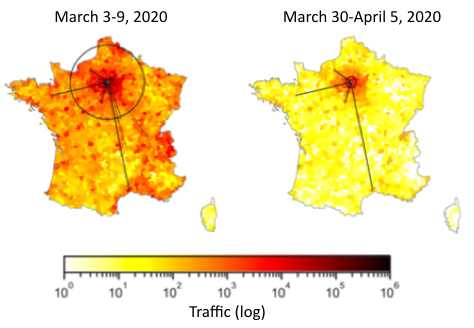
Figure 3: Movement out of Paris during the baseline week starting on February 3 (left) and during the week of lockdown starting on March 30 (right). Locations are coloured by inbound traffic to the selected city. Solid lines indicate the links that persisted during lockdown. The circles contain 95% of outbound traffic. Source: [3]
These mobility drops were unevenly distributed among regions, Figure 4. Reduction in intra-regional traffic was above average for the four regions Île-de-France, Auvergne-Rhône-Alpes, the Grand Est and Provence-Alpes-Côte d’Azur, while it was markedly below average in Bourgogne-Franche-Comté, Centre-Val de Loire and Normandy. Similar fluctuations were observed for outbound flows.
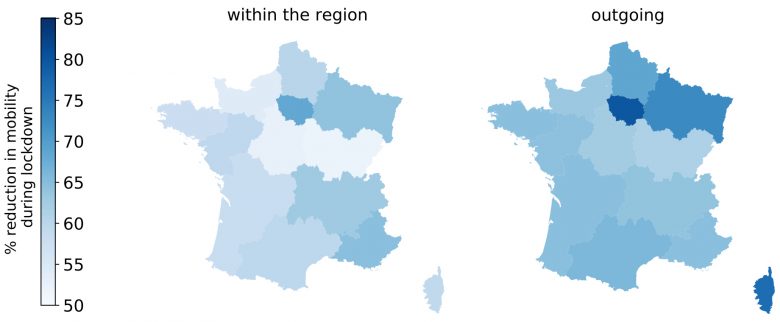
Figure 4: Reduction in mobility between regions caused by the lockdown. On the left, internal traffic within regions, on the right, outbound traffic. Source: [3]
To understand the differences between regions, even though lockdown was enforced consistently across the country, these reductions in mobility were correlated with demographic and economic factors, as well as the epidemic burden. The sharpest declines were seen in regions with the greatest percentage of active populations, Figure 5a, in particular in sectors of activity directly affected by lockdown because of their total or partial shutdown (e.g. tourism, entertainment, hospitality and construction) or with a high rate of people working from home, Figure 5b. Reduction in mobility is moderately associated with the levels of wealth of the most affluent. The latter having jobs that can most often be done from home, which is not the case for lower-wage jobs, more often on the front line, Figure 5c. Also, populations in regions where the burden of COVID-19 is heaviest reduced their movement more drastically than those living in less affected areas. For every 10 additional hospitalisations (per 100,000 inhabitants), there was a 1% decrease in regional mobility, Figure 5d.
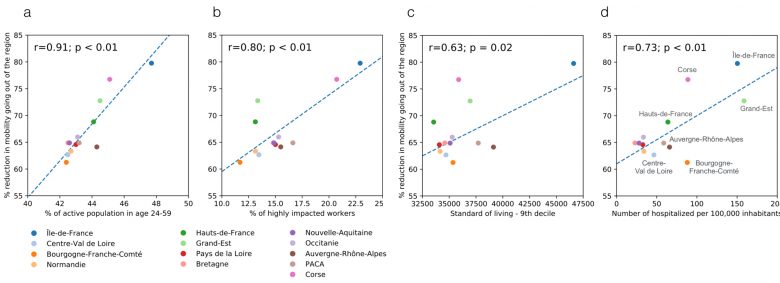
Figure 5: Reduction in outbound mobility for the week from April 6–12, 2020 based on demographic (a), employment (b), wealth (c) and epidemic (d) indicators. Pearson correlation coefficients and their p-values are shown. Source: [3]
A second national lockdown was enforced from October 30 to December 13, 2020. This lockdown was less pervasive with schools and a greater number of activity sectors remained open. As a result, this led to much lower reductions in mobility than during the first lockdown. Overall, mobility was about 32% below pre-pandemic levels, with modest reductions during morning rush hour, Figure 6a.
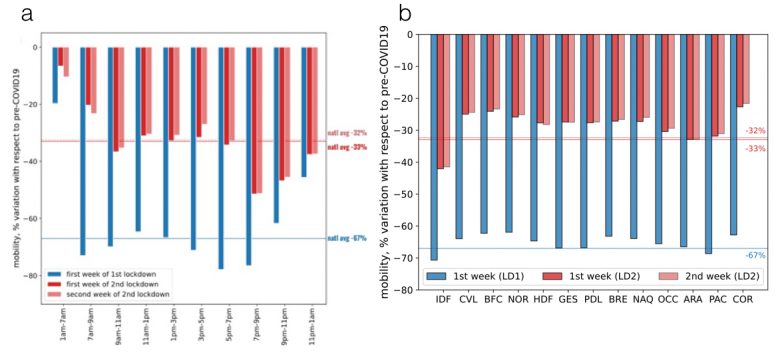
Figure 6: Comparison between the first (blue) and second (red) lockdown. Changes in national mobility broken down by time of day (a), changes in internal mobility in each of the 13 regions (b). The horizontal lines represent national averages. Source: [5]
Analysis on a finer scale shows that above-average reductions were concentrated in the Paris region and in the vicinity of mountainous areas, Figure 6b, affecting long-range mobility more strongly [4].
The regional variation measured during this second lockdown was more heterogeneous than the one observed during the first lockdown [4]. This effect can be explained by, among other things, the difference in the extent of restrictions applied to activity sectors.
The association between reduced mobility and socio-economic indicators, which was also observed during the second lockdown [4], [6], highlights their role in the uneven progression of the pandemic and thus the relevance of taking these aspects into account in the response to the health crisis. The restrictive measures that have followed in recent months seem to be moving increasingly in this direction, with strategies that are more local and adapted to their own characteristics.
[1] Info Coronavirus COVID-19 – Les actions du Gouvernement. http://www.gouvernement.fr/info-coronavirus/les-actions-du-gouvernement (accessed Mar. 2021).
[2] Flux Vision, Orange Business Services. https://www.orange-business.com/fr/produits/flux-vision (accessed Feb. 2021).
[3] G. Pullano, E. Valdano, N. Scarpa, S. Rubrichi, and V. Colizza, Evaluating the effect of demographic factors, socioeconomic factors, and risk aversion on mobility during the COVID-19 epidemic in France under lockdown: a population-based study, The Lancet Digital Health, vol. 2, no. 12, pp. e638–e649, Dec. 2020, doi: 10.1016/S2589-7500(20)30243-0.
[4] E. Valdano, J. Lee, S. Rubrichi, and V. Colizza, Mobility during the first week of the second lockdown in France, Epicx-lab Report, 2020, https://www.epicx-lab.com/uploads/9/6/9/4/9694133/inserm_covid-19-lockdown2-mobility_20201112.pdf.
[5] E. Valdano, J. Lee, S. Rubrichi, and V. Colizza, Mobility during the first two full weeks of the second lockdown in France, Epicx-lab Report, 2020, http://www.epicx-lab.com/uploads/9/6/9/4/9694133/inserm_covid-19-lockdown2-mobility_20201118.pdf.
[6] E. Valdano, J. Lee, S. Bansal, S. Rubrichi, and V. Colizza, Highlighting socio-economic constraints on mobility reductions during COVID-19 restrictions in France can inform effective and equitable pandemic response, Journal of Travel Medicine – in press.

