“L’injection massive est utilisée pour peupler Thing’in”
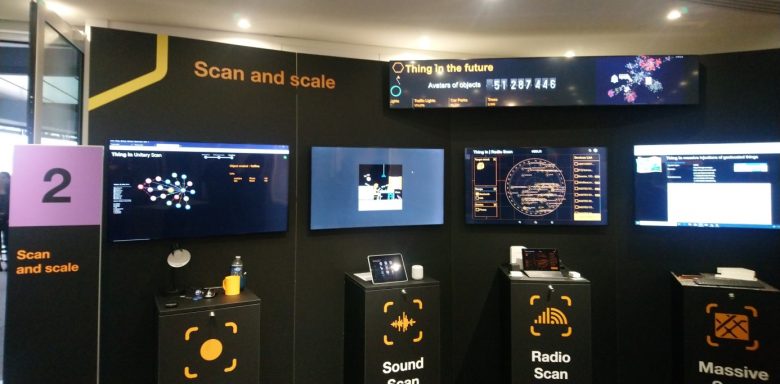
The stand at the research exhibition of 2–4 April 2019 in Orange Gardens (Châtillon, near Paris)
Thing in the future is an integrative research platform dedicated to the Internet of Things. Its purpose is to index connected and unconnected physical-world things and to create relationships between each of them. To simplify the jargon, in Thing in the future, these digital twins of physical things are called avatars. Thing in the future is a multi-sided platform for different stakeholders. It is aimed at owners and suppliers of things who, within Thing’in, create avatars of their things, the relationships between their avatars and their environments, and the methods and information for accessing them. The services that use this information make up another category of stakeholder. Developers of third-party tools are also stakeholders — they provide users with the software building blocks enabling them to enhance, process or visualise avatars on 2D or 3D maps. For this platform to be attractive, it has to be extremely rich in information. Thanks to massive injection, millions of avatars of various kinds (sensors, actuators, furniture, real estate etc.) from the world of transport, smart cities, smart buildings, agriculture and health have been added to the Thing’in graph. These avatars are linked together in order to build bridges between objects from different sectors and facilitate the design of cross-domain solutions. Learn all about the injection methods used and the tools that were developed to add avatars and relationships to the Thing’in graph and gradually build a global directory of things.
How can we discover and “scan” the world?
In a semi-assisted manner, the “Photo Scan” tool uses an image recognition algorithm to detect the type of thing being photographed, without necessarily uniquely identifying it. To overcome this, mechanisms based on cross-referencing information from different modes of capture (multi-modality) and analysing interconnections in the graph can help to uniquely identify things. Linking said things (whether it be connected or not) to other things in the graph is done by creating relationships to other avatars that are in the Thing’in graph, for example the room in which it is located, the building or simply the device that allowed the injection. It is important to establish the relationship of a thing to other things within its environment because seeing the context in which it is surrounded makes it uniquely identifiable. Let’s take the example of a cup and take a picture of that cup. The image recognition algorithm detects that the thing is a cup. For the time being, identification requires filling in fields/attributes, such as the name or colour of the thing. With time, recognition will be automatic. The graphical interface of the “Photo Scan” tool makes it very easy to add an instance of the thing and its relationships in Thing’in. The avatar is therefore created and integrated into the global Thing’in graph.
The “Radio Scan” tool injects connected things into the graph by identifying the protocols of equipment communicating wirelessly via Wi-Fi, Bluetooth or NFC using radio waves. Connected things are detected by analysing the messages being exchanged by them. At home, it is possible to discover all connected things within range, such as laptops, tablets, connected watches or bracelets, connected speakers, motion detectors and many other things. Out and about, the tool will detect other types of connected things, such as a beacon or hotspot found in shops, restaurants or public places. Avatars are added to the graph by creating relationships to other avatars describing the context.
Things can also be recognised based on a sound signature. The “Sound Scan” tool recognises sounds that identify a number of things in a house, such as musical instruments, kettles, washing machines and other household appliances. Eventually, the “Sound Scan” tool will be able to recognise a much larger number of things, including industrial objects. Sound recognition recognises things as well as detecting a change in status of the things, for example washing machines switching to spin-drying phase. The “Washing Machine” thing is created in Thing’in by the tool and its status is updated as soon as the sound recognition algorithm detects a new sound indicating a change of status. We can therefore picture a service that will be able to inform users by sending them a text or email that their laundry is almost finished.
Populating Thing’in would require a very long time, as avatars are created one-by-one. Using the platform’s APIs, the database can be enriched more quickly by automatically creating avatars and relationships using a program. Massive injection is used to populate Thing’in from large data sources such as open data, digital building plans or OpenStreetMap. Massive injections from OpenStreetMap areas or digital building plans are used to create avatars and relationships of things in the graph, representing all the roads on a map or all the floors and rooms of a building. To inject an OpenStreetMap, the user selects the geographic area of interest. All roads in the selected area will be injected into Thing’in. Injecting a digital building plan in the Building Information Model (BIM) format is done by creating all the avatars that match the building’s topology in Thing’in.
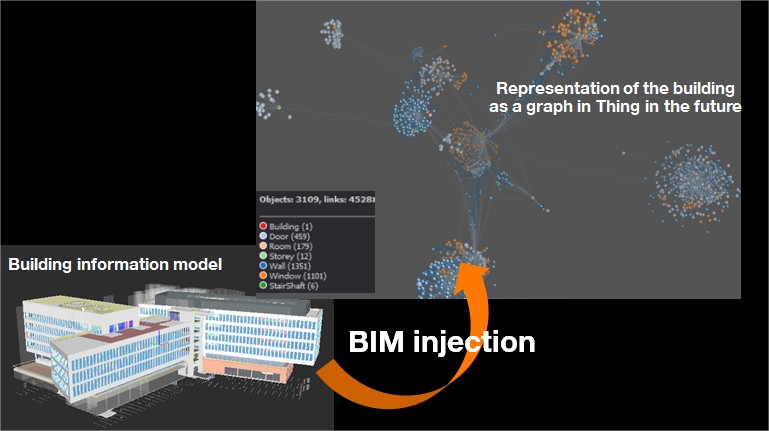
Injecting the BIM plan of a building into the Thing in the future graph
Since a building has several floors, the graphical representation of each floor is connected to the building as well as to all the rooms that make it up. A room is itself made up of walls, floors, ceilings, windows and doors, which are themselves connected to the room by relationships of containment or belonging. Between two rooms, there will be relations of adjacency or passage if there is a door or access between the two rooms. Connected or unconnected things can also be linked to a room if they are in the room (IsIn relationship). This information is very useful for developing building management services. Thing’in provides all the search functions to find the closest things to a room or the shortest route to a fire extinguisher, for example.
How is Thing’in structured to manage billions of things?
Injecting a wide range of data constantly increases the size of the graph. To date, there are over 51 million avatars in the Thing in the future platform — including various types of avatars that are connected to each other (GSM aerials, roads, buildings, street lights, traffic lights, car parks, bicycles etc.). The graph of things and relationships is able to grow over time thanks to the platform’s capacity for scalability. It can be deployed very widely thanks to its distributed cloud architecture designed natively in such a way that processing units are dynamically allocated depending on needs. Thing’in is currently deployed on Orange’s public Cloud infrastructure. Over time, the avatar graph will be deployed in a geo-distributed fashion across the globe on various infrastructures hosted by Orange and/or potentially by its partners to optimise costs and quality of service (by getting closer to the users). To do this, the graph needs to be intelligently partitioned so that it can distribute the data on a set of servers in multiple data centres while maintaining performance. This geographical distribution must take into account the main characteristic of the Thing’in graph: whatever the number of things being managed, their nature (sensors, actuators, furniture, real estate etc.) or their domain, their avatars are interconnected in a single massive graph. The main difficulty is “slicing” this graph in such a way that avoids user queries needing to contact several servers for a response, as this would have an enormous effect on response times.
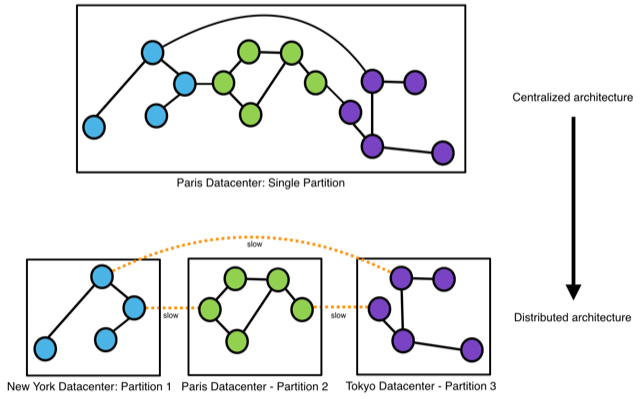
Compromise to be found between graph partitioning and performance
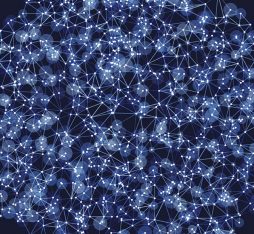
The above image illustrates a graph partitioned using nodes that form three loosely interconnected portions. This network can be divided into three portions, each subnetwork being managed by a server. The Thing’in graph is a fairly accurate representation of the highly entangled networks of relationships that exist between real-life things. This means that partitioning it is very complex. Interconnections between servers cause some slowness and a compromise needs to be found between graph partitioning and performance. The aim of the research work carried out in the team was to come up with efficient solutions for partitioning the Thing’in graph, which will be deployed in a widely geo-distributed fashion. Particular attention was given to optimising geographical searches to find avatars located within a given geographical area. The partitioning of the graph takes into account various factors and attempts to group avatars based on their GPS positions.
Thing’in was designed in such a way that it can manage an unlimited number of avatars and relationships and thus become the global repository for the Web of Things. Users are provided with tools to represent their things in the graph. Scalability is made easier by the cloud platforms’ capacity for scalability, resilience and automation. Thanks to the research undertaken, transitioning from a centralised architecture to one which is widely distributed will allow the data graph to be deployed massively without end-user performance being affected. A lot of work remains to be done in terms of data protection and security for Orange to achieve its ambition with this platform, which must constantly be adapted to satisfy new user usage while reducing its energy consumption to protect the planet.
Thing’in, the things’ graph platform
Beyond IoT: Digital twins and cyber-physical systems
BIM for building the world of tomorrow — Autodesk
BIM: The importance of the IFC file format — BibLus
For more information about graph partitioning:
Using a partitioned graph in Azure Cosmos DB
DSE Graph partitioning
ArangoDB Enterprise SmartGraphs: Scaling with Graphs
Graph partition (Wikipedia)


